Data…data….everywhere. But what’s the point?
Data seems to be a never ending story as a teacher now a days. Naplan and PAT-R, diagnostics, tests, assessments and MAIs. So many acronyms, so many numbers. But what’s the point really?
We collect an array of data on kids, look at it, go “ooo, this kid is good at that and needs help here…” then we leave it.
Why?
Because as a secondary teacher, you teach generally between 200 and 300 students a year.
Well, actually in a fortnight.
In fact, I remember one year a teacher (in a previous setting) having 13 classes. That’s about 415 students. A friend of mine had 390 students in her first year of teaching. It’s hard to keep the names straight from lesson to lesson. Then, tracking student achievement so that you know where students are up to in your subject matter, assessing against 15 odd outcomes for each child for each class, catering for diverse needs, or even remembering them in class…it’s hard work.
For my teacher friend with 390 students, on average 15 outcomes a course, that’s 5,850 outcomes to report against. Wow.
Add to that the marking…and for those 5850 outcomes….consider this…a dear friend of mine currently teaching Engineering just collected engineering reports from students in year 11….the length of student responses ranged from 17 pages to 56. 12 point Times New Roman. For a 20% task. A general Industrial Technology or Design and Technology folio is 80 pages long.
The life of a teacher is hard.
While marking these 80 odd page portfolios, you are also sometimes working with students who can’t read at above a primary school level, who are expected to construct an 80 page response, along with a four page essay response, timed, within the HSC…and expected excellence within this, because in the HSC, one mark can make a difference.
So, what’s the point?
The point is that it helps us to know the student. Looking at data can help us to understand at a base level, what students will possibly have difficulty with, things that they are strong at, and things that we can support and focus on across a grade level. When you look at the data that we collect from our Maths Pathways system, that is utilised across stage 3 and 4 at St Luke’s, you can see the power of this data collection.
Let’s look at this student below, who is currently sitting in year 5 at St Luke’s. The light yellow shows maths that he has already achieved in the first 8 weeks of stage 3. He has most of the elements of maths from year 1 through to year 8, with some elements of advanced maths in year 10 already achieved. Would we have been able to see this if we didn’t have this system? Does this data come up on an MAI? And now that we have this data, what do we do with it? We now have a moral imperative to act on this data. Does this student even like maths? Yes, he tells me, his reason for coming to school in the morning. Do you find it difficult? No, sometimes it’s a bit boring because it’s too easy. Would you be interested in doing something a bit more difficult? Oh yes.
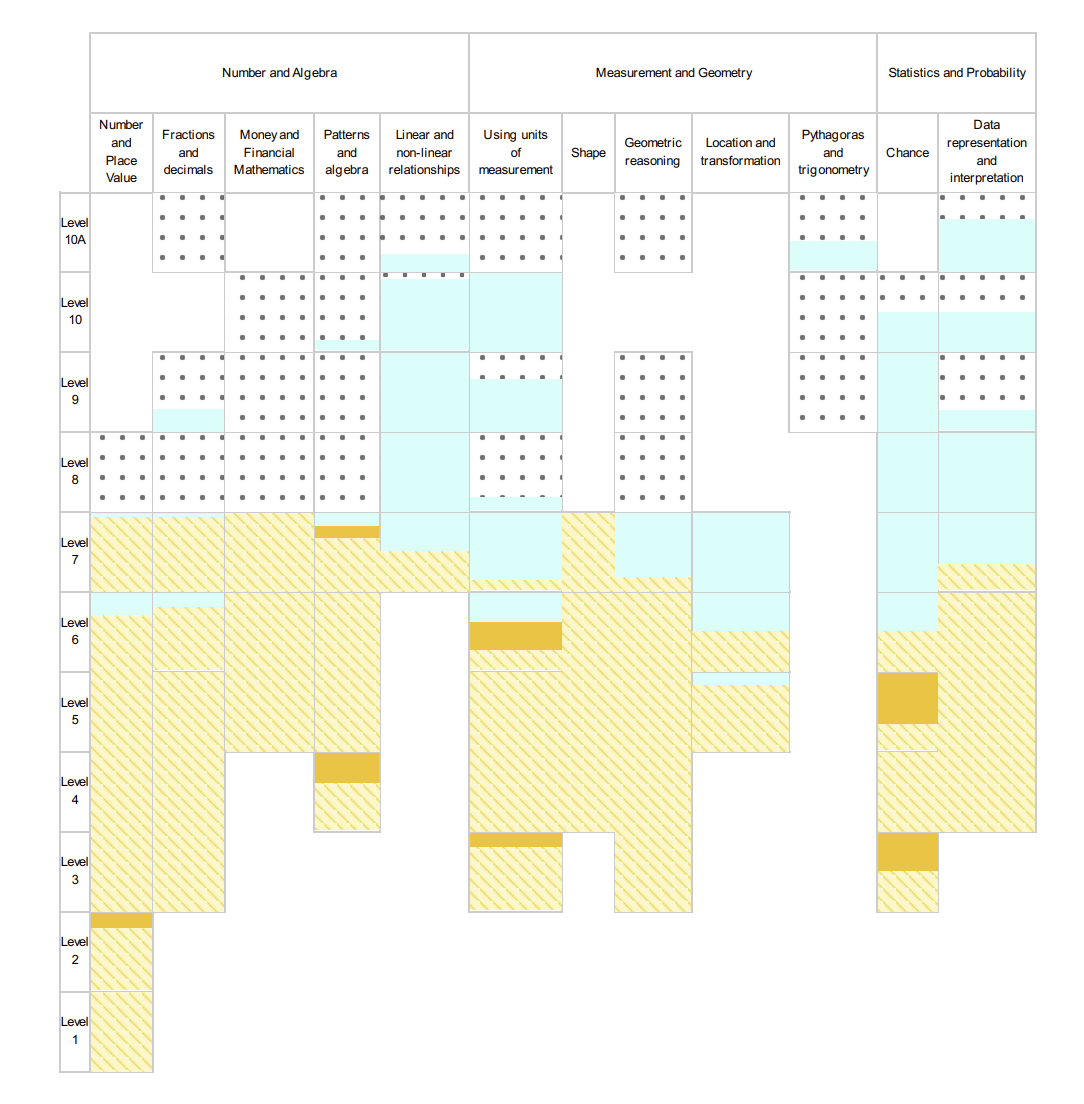
On the other hand we have students who are having difficulty in single strands of maths…that are up to the level that they need to be in every area except, say, geometric reasoning. Why are we making them sit through algebra at a level below what they understand when they are missing particular elements that we can then address individually, or within group workshops.
So if this is a moral imperative, how can we do this when we’re trying to “focus” on 300 odd students (5,870 outcomes), when we’re in class, and we have so many different data sets, how do we quickly figure out where a student is “at”? How can we put faces on this data? How can we make student data more accessible so that not only do we bring up a student’s mathematics data from Maths Pathway, their NAPLAN data and their PAT-R data at the same time, because we know that a students ability to demonstrate achievement in mathematics is often affected by their ability to read and understand the question? How do we track data so that we can make improvement in students over time, so that we can look at student reading, writing and numeracy data at the same time, while also reading data about their abilities within capabilities. And how can we make this accessible for teachers not only in their breaks, but while they are doing the work? In a way that doesn’t require too much work from a teacher, as they’re marking their 1000 odd pages of work (like my Engineering teacher friend).
I’ve thought about this a lot over the past 7 weeks, and have spent some time exploring some different solutions. What I really wanted was something accessible for teachers, where they could take notes on each student within their classes, which could then be shared across multiple teachers. So, when a teacher discovers a strategy with student X, that works with that student when it comes to say, reading, they could add it to the note and instantly have this available to the teacher on the next period class. So, when you are sitting in a class and you notice that a particular student is lost, you can search this online system and have it display data instantly on the student…a card for their reading, one for writing, one for numeracy….one for their ability to create, one to think critically, to witness, to manage self, relate to others, and to inquire.
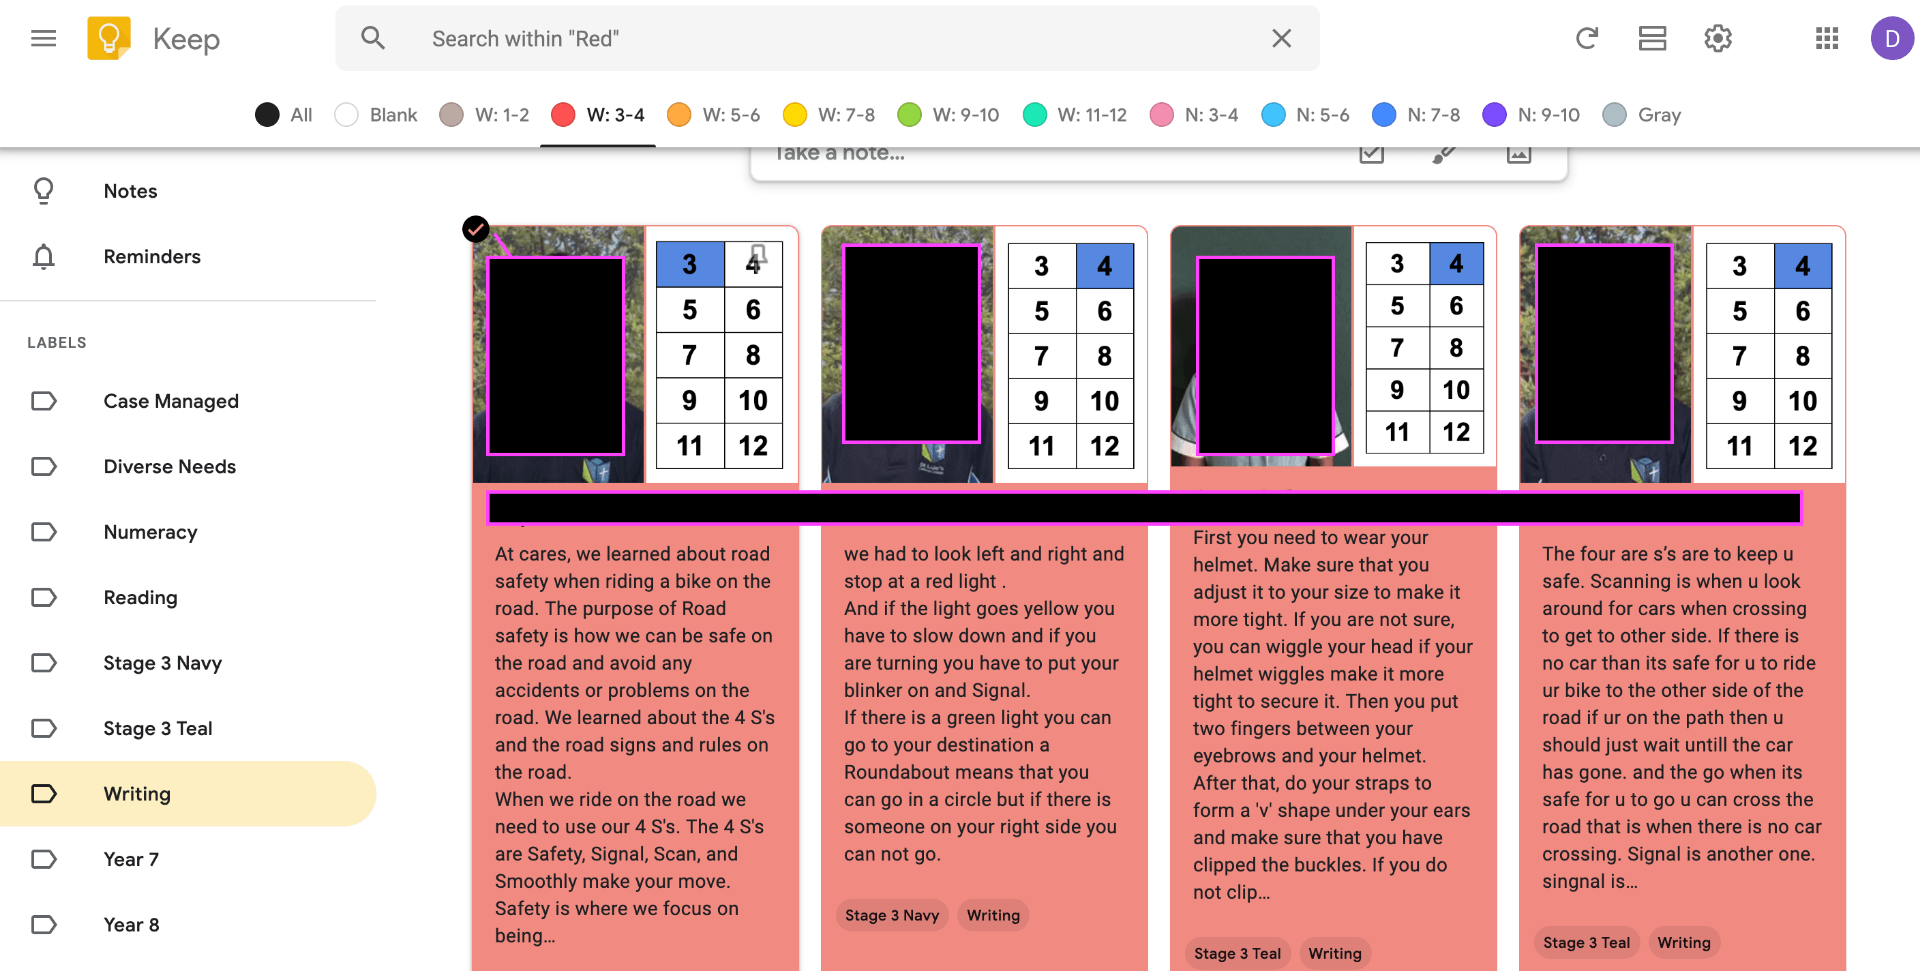 Utilising Google Keep, we’ve been able to do this and have this double as a digital, portable, instantaneously accessible data wall, that can also sit as a data wall in the staff room, continuously projected on a screen so that teachers can have discussions and constantly have student levels “in their face”.
So, a teacher can tag a student for case management, for diverse needs, for a particular level of ability, for a class, and for a subject. So we can then filter instantaneously for these students. We can also search for an individual student and see all their cards. More importantly, we can see students moving up, down, or getting stuck. We can attach notes about students, or in the case above, samples of their work for close examination.
It’s all about working smarter, not harder. How can we know our students better, when you have the faces of hundreds of students going past you in a fortnight. We all know that knowing our students and how they learn is an essential part of being able to be the best teacher you can be.
Let’s figure out how we can do this without being overloaded with numbers, acronyms and spreadsheets.
This post resonates with me so much. As I was reading I was reminded of Sharratt’s (?) ‘Data today is tomorrow’s instruction’. I think while the moral imperative is to strive for precision, the fact of the matter is that there is a great deal of data that is background noise. What we measure and what’s worth measuring are two very different things. Where we can move to in, or as close to the moment, decisions the more impactful we will be with our craft. The summative is needed to notice patterns and puzzles. It’s not one without the other, but as you said, lessening the load is of prime importance.
Brilliant process for helping us to plan for individuals, also thought you could expand the Google Keep file with sound bites and images of the work. This is BIG. BRILLIANT. WONDERFUL